

In my previous blog, I discussed the business need for a high-performance bidder, the challenges of implementing such a solution, and the technology stack we used (Java and Vert.x). This blog post builds on the previous one by providing more details on how we diagnosed bottlenecks and made changes to the infrastructure to handle increased traffic.Challenges with increased trafficAfter integrating with the first supplier-side platform (SSP), we quickly began working on integration with the second SSP. We completed the integration, user acceptance testing, and live testing in a few weeks. However, once we went live with the second SSP, we noticed that the bidder was responding to only a small percentage of the incoming bid requests and was losing most of the bids that it did respond to.The Kubernetes pod CPU and memory usage were within the threshold and around 20–30% and the pod-level response time was also fine at around 60 ms. Looking beyond the pod-level metrics, when we looked at the metrics in AWS, we noticed that the p99 response time was well over a second. So, it looked like the issue was somewhere within our infrastructure.
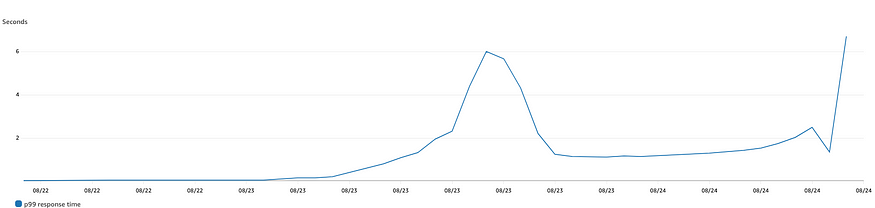
P99 response time at the Load Balancer as the traffic increased
When we looked at the EC2 instance network bandwidth metric, it peaked at around 1.5 Gbps. It looked like the traffic was getting throttled at the EC2 instance due to the bandwidth being allocated to the instance. As per AWS instance bandwidth documentation, instances with 16 vCPUs or fewer (size 4xlarge and smaller) have a baseline bandwidth before their traffic is throttled. AWS allows instances to use network I/O credit mechanisms to burst beyond their baseline bandwidth for a limited time, typically from 5 to 60 minutes, depending on the instance size.We were using the m5.xlarge instance type which has a baseline bandwidth of 1.25 Gbps. To validate this hypothesis, we switched the bidders to the m5.2xlarge and immediately the EC2 bandwidth consumption went up to 2.5 Gbps. The below image illustrates the bandwidth utilization was below 1 Gbps till 23rd August (the day bidder started receiving the second SSP’s traffic) and it started going up but stayed around 1.2–1.5 Gbps till 25th August. Once the instance type was changed on 25th August, the network bandwidth went up to 2.5 Gbps but didn’t burst beyond it.
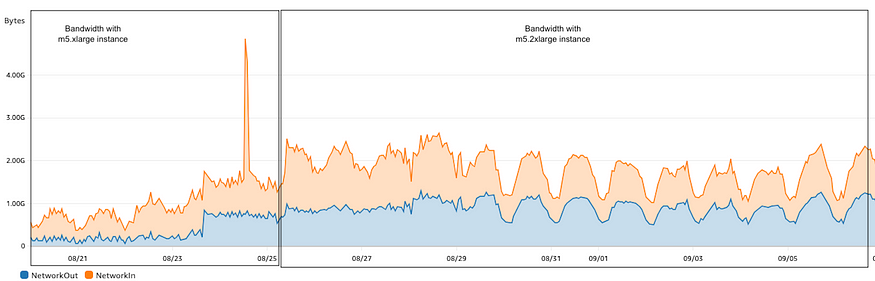
EC2 Network bandwidth usage
After increasing the network bandwidth, we observed an increase in pod-level response time. This confirmed that the pod was now receiving more traffic. In addition to changing the instance type, we also had to increase the CPU and memory allocated to the bidder to handle the increased traffic.We analyzed the code and made some optimizations to reduce the response time. The p99 was around 500 milliseconds at this time but it would inch towards a second during periods of peak traffic. We were reaching the limits of the performance we could achieve with a single EC2 m5.xlarge instance and we did not want to continue to vertically scale. So, we decided to explore how we could horizontally scale the bidders.As we were caching all the data in memory, we could not simply increase the number of instances. If we did, each pod would store the same budget for each campaign, which would lead to overspending. We started looking for a quick short-term solution that didn’t require a lot of code or infrastructure changes, so we could horizontally scale the bidder while we figured out a long-term solution.Short-term solutionOne of the solutions we explored was to allocate different campaigns to different instances, but we could not guarantee that the bid requests applicable for the campaign would reach the corresponding instance as the inbound request URLs did not contain the identifiers needed to route the request to different bidder instances.We also thought of segregating the traffic for each SSP to a different instance, but this would not have helped a lot as the traffic from one of the SSPs was significantly higher than the other.The solution we finally agreed on was to horizontally scale the bidder. But one challenge with this was that the budget data for each campaign was being maintained in memory. So, if we had a campaign with a budget of 100, each instance would end up storing the budget as 100 for the campaign and we would end up spending 3X the allocated budget for the campaign. To overcome this, we decided tosplit the hourly budget for each campaign across all bidder instances. So, in the case of the campaign with a budget of 100, if we had 3 instances of the bidder, each instance would be allocated a budget of 33.3. This solution was based on the assumption that the load balancer would distribute requests evenly across the instances.With this solution in place, the p99 was around 250–300 ms for about 15000 requests per second. This was with 3 instances of the bidder running on separate m5.xlarge instances with 1 CPU allocated to each pod and a memory allocation of 8 GB. The increase in memory allocation was primarily due to an increase in the number of campaigns.The short-term solution improved bidding performance by reducing the load on the system. However, it still had some drawbacks. For example, 10% of bids timed out because they were not placed in time. Additionally, one instance occasionally spent its entire budget while the others still had some budget left. This was because only one instance received more bid requests than the others for a single campaign. So, we immediately started looking at a long-term solution for this problem.Long-term solutionSince multiple threads would be trying to update the budget concurrently, it was important to make sure that the data store we chose to store the budget was not only low-latency but also supported transactions.We were already using AWS Elasticache Redis as a cache in some other parts of the application and therefore the first experiment we conducted was to use Redis as the data store since it was fast, low-latency, and supported transactions. The results in the experiment were promising and the performance was comparable to the in-memory storage. The resulting increase in latency was about 5–10 ms per request.When replacing the in-memory cache with Redis for budget storage, we found that the piece of code that was updating the budget in the in-memory cache was doing so in a synchronized method. This meant that all the threads were getting blocked when one thread was updating the budget. To get rid of this in the Redis-based storage solution, we used optimistic locking along with transactions. As a result of the usage of Redis and the code optimization to get rid of the synchronization, the p99 response time came down to 40–50 ms.We used Redis just to store the budget for the campaign and the rest of the metadata about all the currently running campaigns, which ad creative to use, which sites to target etc was still kept cached in the JVM memory. The reason for this approach is that the frequency of change of the metadata was hourly and independent of the incoming bid traffic whereas the budget would change based on the bids responded.ConclusionWe were able to successfully address the bidding performance issue by implementing two solutions. The short-term solution, which was released in a week, reduced the load on the system and improved the bidding performance. However, it still had some drawbacks, such as the possibility of not having enough budget left to bid. The long-term solution, which was implemented in 3–4 weeks, addressed these drawbacks by using Redis as the data store. This solution was able to bring the p99 response time down to 40–50 ms, which is a significant improvement. Currently, the bidders handle about 30–40 million requests per hour. We have 3 instances of the bidder running with the CPU allocation of 1–2 CPU and memory allocation of 8–12 GB.
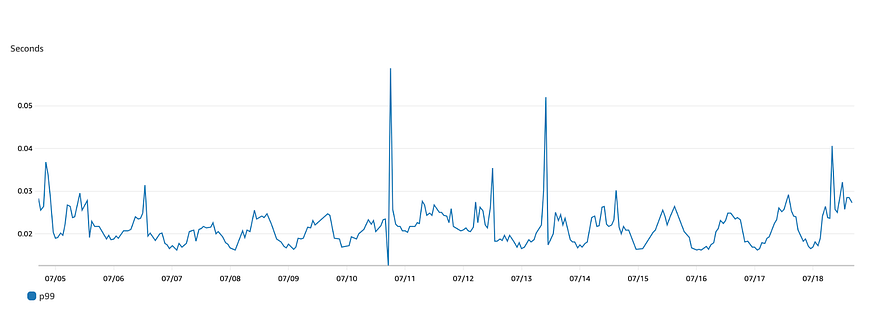
Recent p99 response times
The key takeaway is that when designing high throughput and low latency systems, it is essential to collect enough metrics to identify bottlenecks. Additionally, the system must be built in a way that allows for future incremental improvements.

